Change of environment sometimes does wonders.
The last time I spent more than a week in Lahore was when I was working on my thesis. And those were very bad days. I was getting nothing done, and was enjoying myself neither. Getting back at home did improve things a lot.
I knew I would have to come here again for a few days (i.e., in these days — the time of writing this), but when I changed my plan to stay here for a week and a few days, I was getting anxious that I might return to the same state as I was in those thesis days.
I arrived Lahore yester-evening, and I turned out to write two essayish blog posts in two successive days (only a night’s sleep apart). A funnier way to frame this is this:
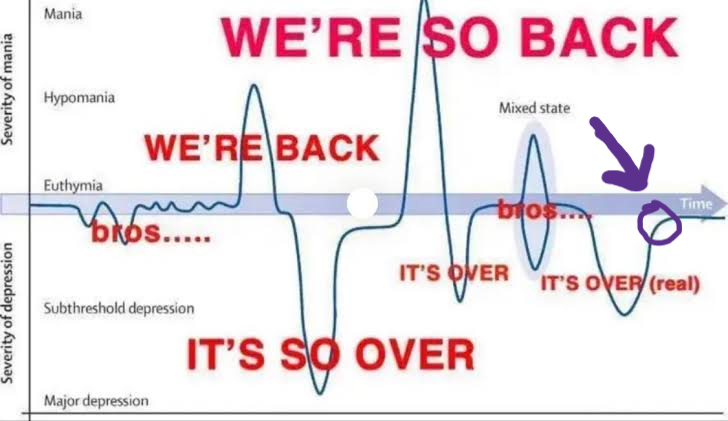
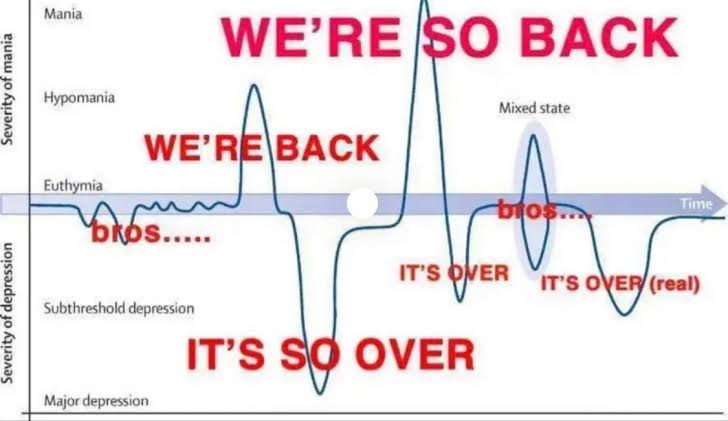
Few days back I had shared this graph with a friend:

I think my life is this graph on loop, super-imposed on a slightly positively sloped straight line.
So, at the time I had shared it with my friend, I felt like I was at the purple point:
Now, I think that, I was at orange point then1 and now am at the green point.
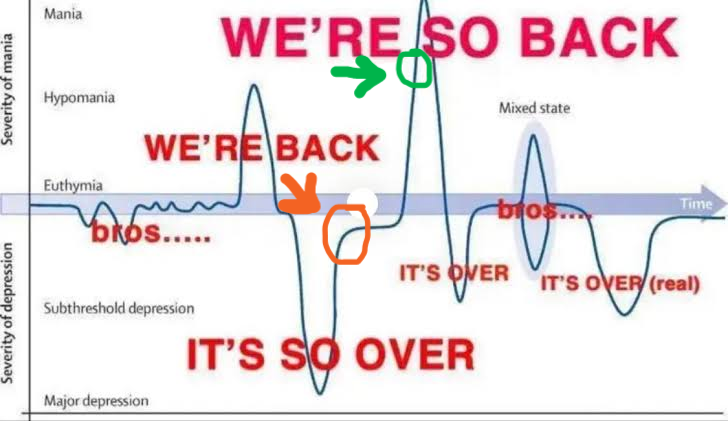
So yeah, I feel like in the I’m so back phase and the peak has yet to come soon. Also, I realize this graph is a handy tool to share updates with friends. So, sharing this graph here, so that if you wanna share updates with me, you can do so by marking this graph. Thank me later 😂
- And tbh, it was literally so over (details are TMI and hence can’t be shared, but I am not referring to the thesis phase.) ↩︎